The Engage Marketing Attribution Report makes it simple to understand how email Campaigns and Automations are driving business impact. It allows Engage users to see at a glance how many Orders and how much Revenue are being driven from a particular marketing email.
Engage customers leverage this report to:
- Identify top performing Campaigns/Automations
- Measure the impact of email content views
- Analyze the time from marketing event to transaction
Note: If you are an Engage Marketing customer that uses Olo Ordering but do not have access to the report, please reach out to your Customer Success Manager.
Table of Contents
Marketing Attribution Report User Interface
Depending on the size of your screen, you may need to zoom out to see the full report within your viewport.
-
Windows users: ‘CTRL’ + ‘-’
- Mac users: ‘Command’ + ‘-’
Report Filters and Metrics
These elements are configurable by the dashboard user as described below.

-
Date Range: Option to select either All Time or Custom Range.
-
All Time: Data goes back two complete years plus the current year-to-date. For example, if viewing the report on March 6th 2024, the report will have data going back to January 1st, 2022.
-
Start Date: If Custom Range is selected, the user can select the date in which the report period will begin.
-
End Date: If Custom Range is selected, the user can select the date in which the report period will end.
-
Concept: The name of the Concept in the Engage Dashboard.
-
Name: The name of the Concept’s email Campaign or Automation.
-
Marketing Event: Option to select Campaign, Automation, or both.
-
Campaign: A scheduled email to a defined Segment or List configured from the Campaigns section of the Engage Dashboard.
-
Automation: A trigger-based email configured from the Automations section of the Engage Dashboard.
-
Guest Engagement Type: Option to select either a Delivered, Opened, or Clicked based attribution methodology.
-
Delivered: The Marketing Event (i.e. email Campaign or Automation) was successfully delivered to the guest. Emails that are Bounced, Deferred, or Dropped (hard or soft) are not included.
-
Opened: The Marketing Event (i.e. email Campaign or Automation) was successfully opened by the guest.
-
Clicked: An element in the Marketing Event (i.e. email Campaign or Automation) was clicked on by the guest.
-
Metric: Option to select either Total Orders or Total Revenue
-
Total Orders: A closed order successfully transacted and concluded between the guest and the concept.
-
Total Revenue: The subtotal spent by the guest on the closed order, excluding taxes, tips, and other fees on the sale.
-
Metric Format: Option to select either Whole Numbers or Percent of Total.
-
Whole Numbers: The Total Orders or Revenue displayed as an integer. When analyzing Revenue, no dollar sign will be displayed.
-
Percent of Total: The Percent of Orders/Revenue on a particular day out of the total days in the Attribution Window. The Grand Total column should always reflect 100%.
- Note: This isn't a configurable Filter. Whole Numbers is used in the Order Attribution (# View) tab and Percent of Total is used in the Order Attribution (% View) tab.
-
Attribution Window: The number of days from 0-15, where 0 represents order activity that occurred after the guest’s engagement with the email but on the same day. The report defaults to 7 Days but can be adjusted by the user. For Automations, the filter adjusts the Heatmap Table based on when the guest engagement occurred.
- Guest A received an automation on Monday, so Tuesday is considered their Day 1
- Guest B received an automation on Friday, so Saturday is considered their Day 2
Report Interface
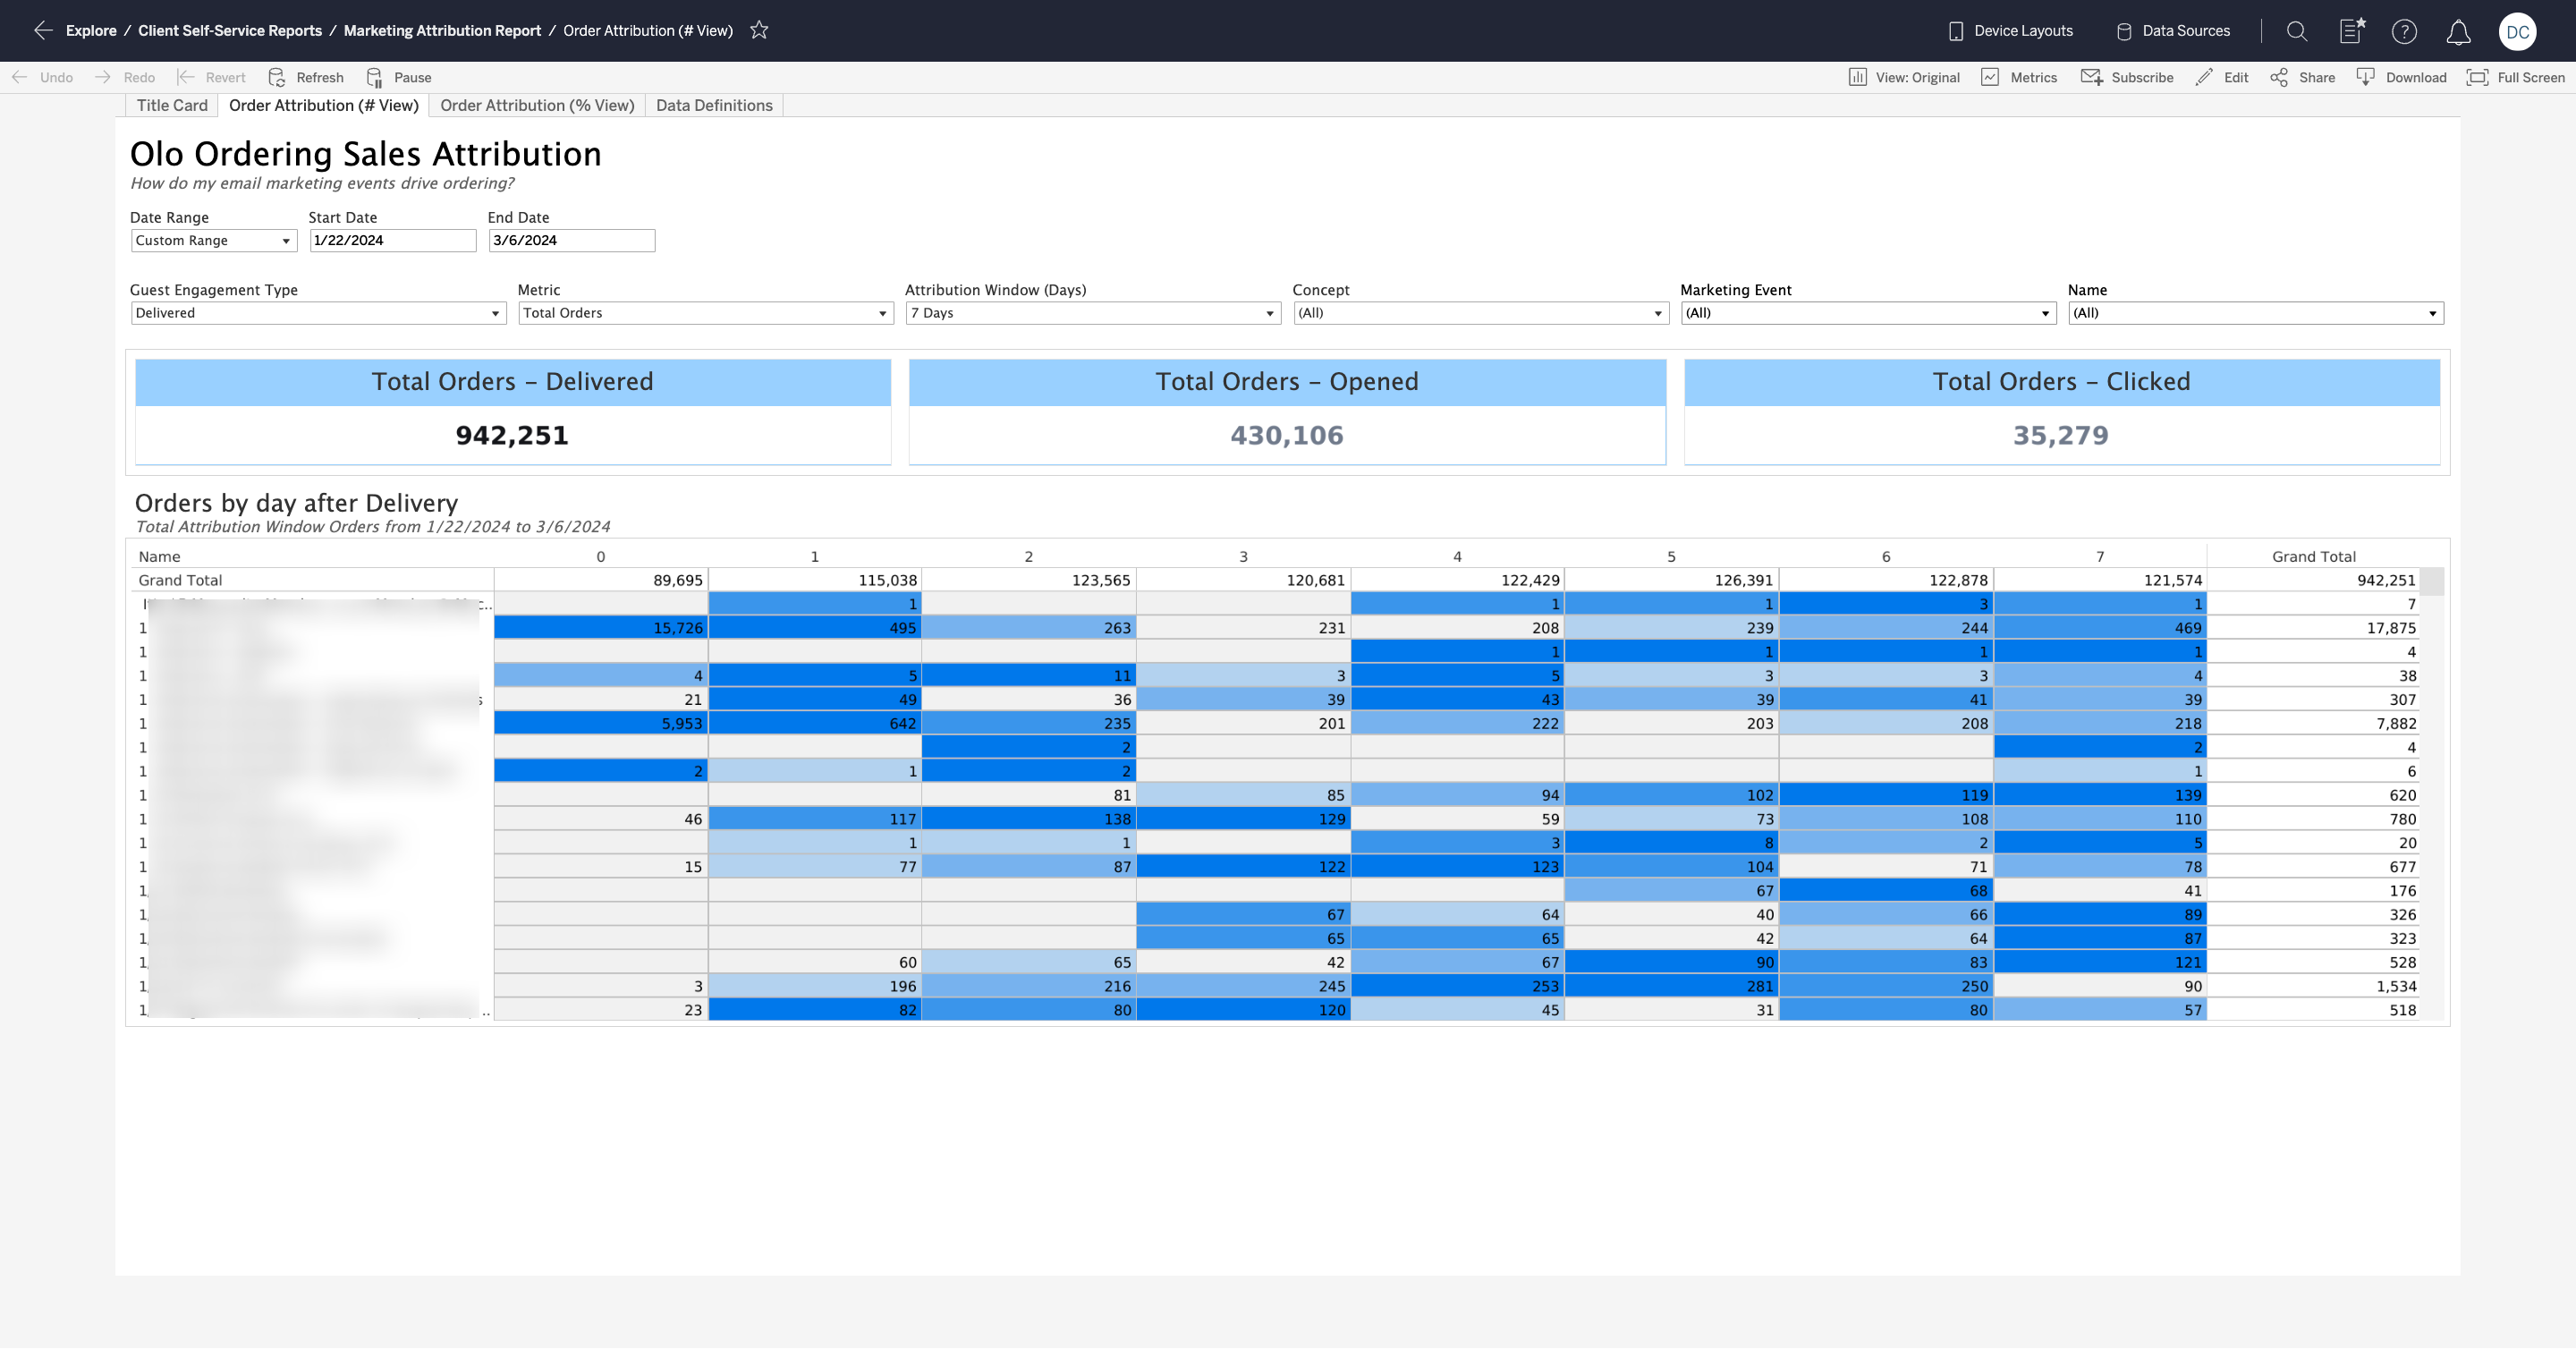
The report has two primary sections: Banner Metrics and Heatmap Table.
Banner Metrics are located at the top of the report and consist of three Metric cards; one for each of the Guest Engagement Types. These values will update as you switch between the two Metrics but will persist as you select different Guest Engagement Types. You can easily tell which Guest Engagement Type is being used because that card will have its value in bold.

Below the Banner Metrics section is the Heatmap Table, which dynamically populates data based on the selected filter values.
- Table Title: Indicates the Metric and Guest Engagement Type being used to populate the table.
- Table Description: Indicates the Metric Format and Date Range being used to populate the table.
- Marketing Event Name: The name of each specific Campaign or Automation, one per row.
- Attribution Window Header: One day per column, with the total number displayed depending on the Filter setting. In all cases, day 0 and Grand Total will populate.
- Metric Value by Day: The number of Orders or Revenue that occurred on a specific day within the Attribution Window.
- Metric Value Total: The Total Orders or Revenue that occurred across all days in the Attribution Window.
- Heatmap: A color coding ranging from solid blue to gray, with the darker blue representing the highest concentration of Orders or Revenue and lighter gray representing the lowest (or no) concentration.
Interpreting Attribution Data
The Marketing Attribution Report enables users to view data in multiple ways, empowering them to draw insights based on their specific needs. For example, in the screenshot below we can see that between 1/22/2024 and 3/6/2024, there were 430,106 Online Orders made within seven days of a guest opening a marketing email.
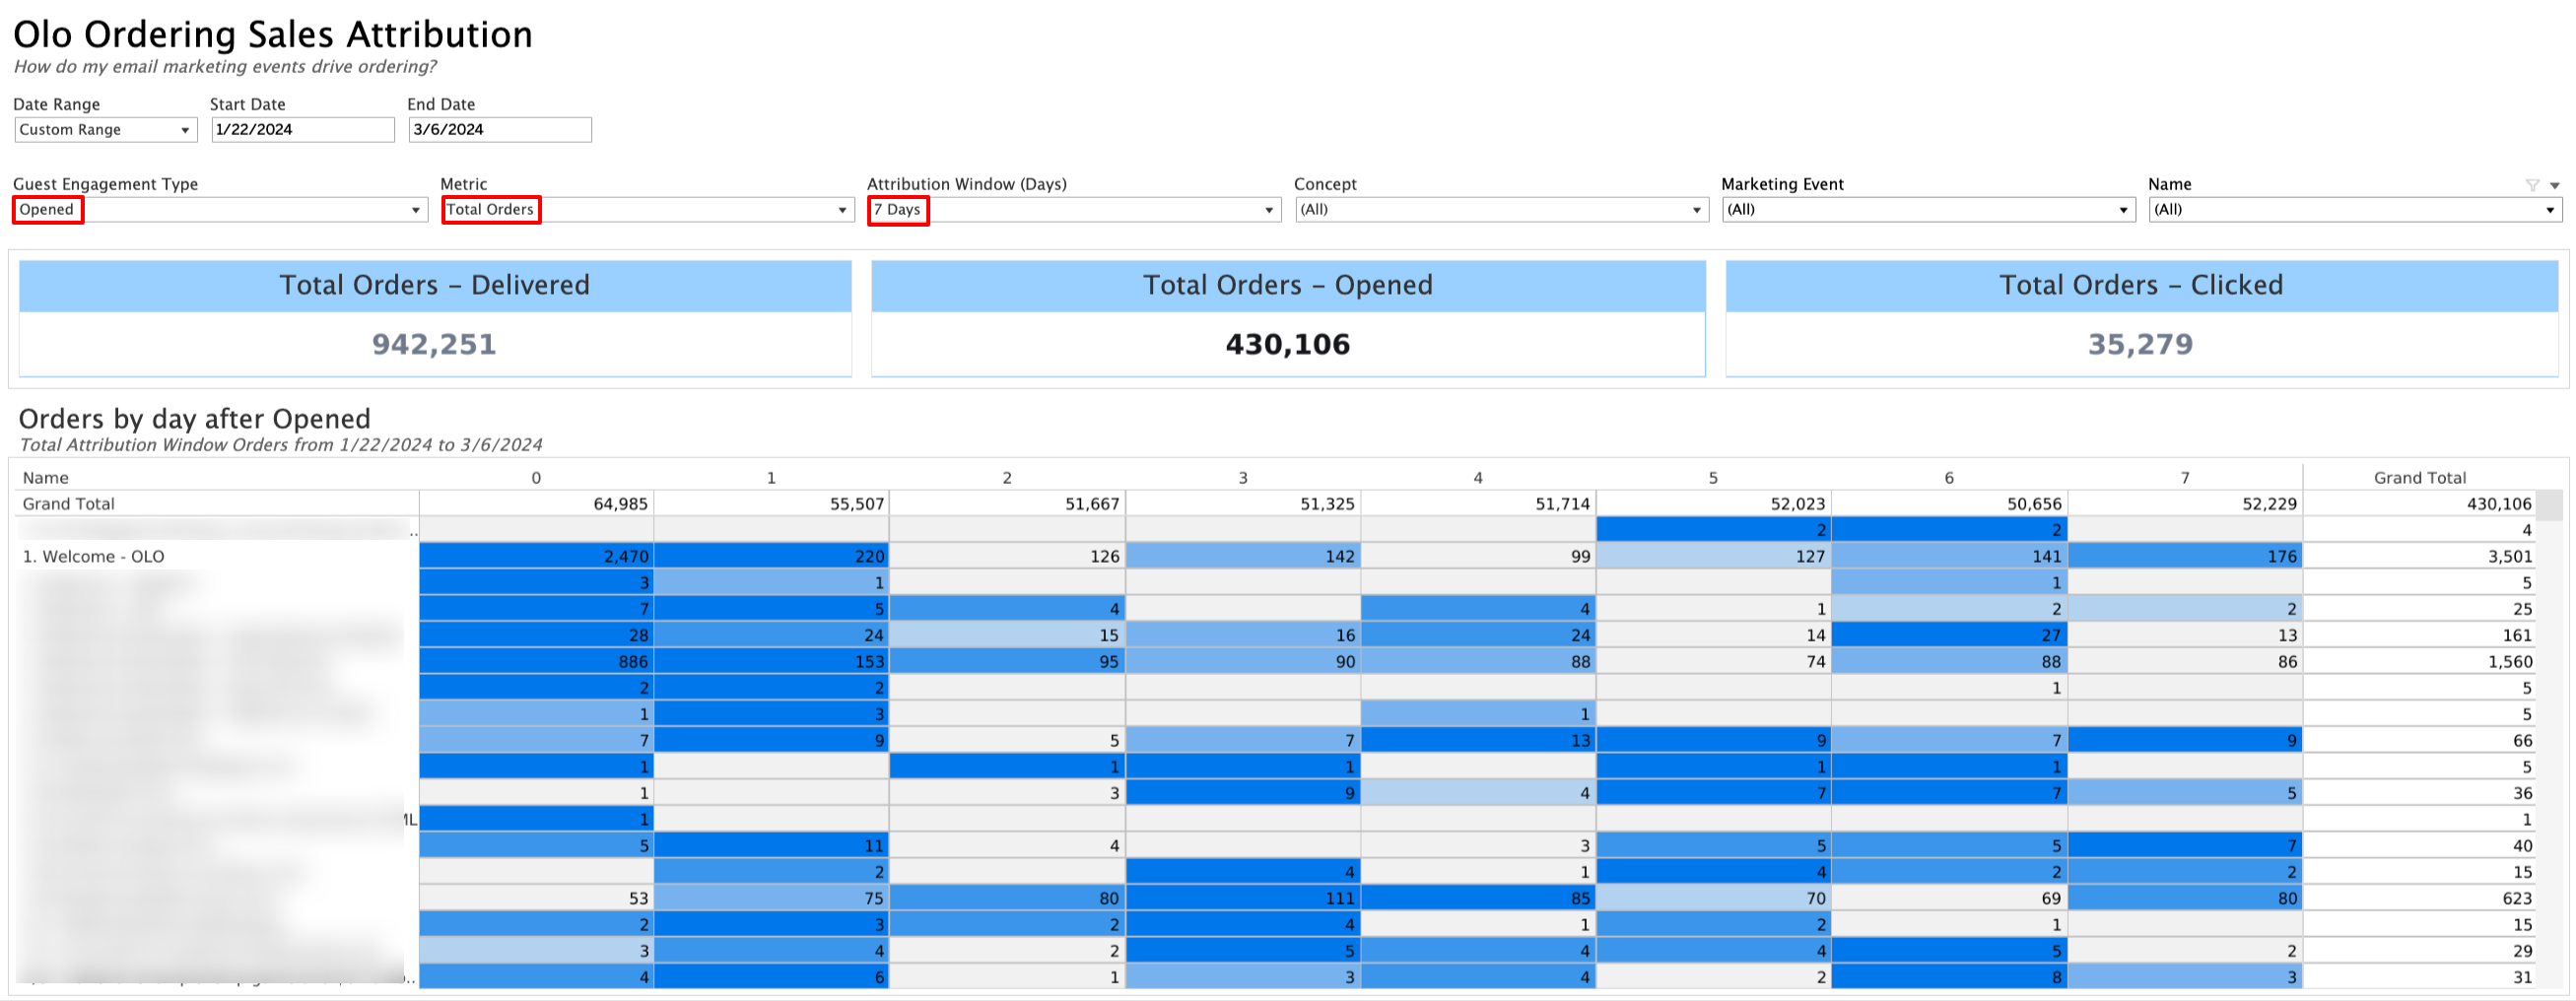
One of the most important filters to keep in mind when using the Marketing Attribution Report is the Guest Engagement Type. Delivered is the broadest attribution methodology and will always show more Orders/Revenue than Opened or Clicked. While it is not connected to a guest taking a specific action, a guest may have seen but not opened the marketing email.
Opened is the “middle” attribution methodology because it requires the guest to explicitly take an action, which for a brand guarantees the content was actually seen. Clicked is the narrowest attribution methodology because it requires the guest to click on a URL within an email in order to be counted. While a valuable data point, it generally undervalues the overall impact of marketing emails.
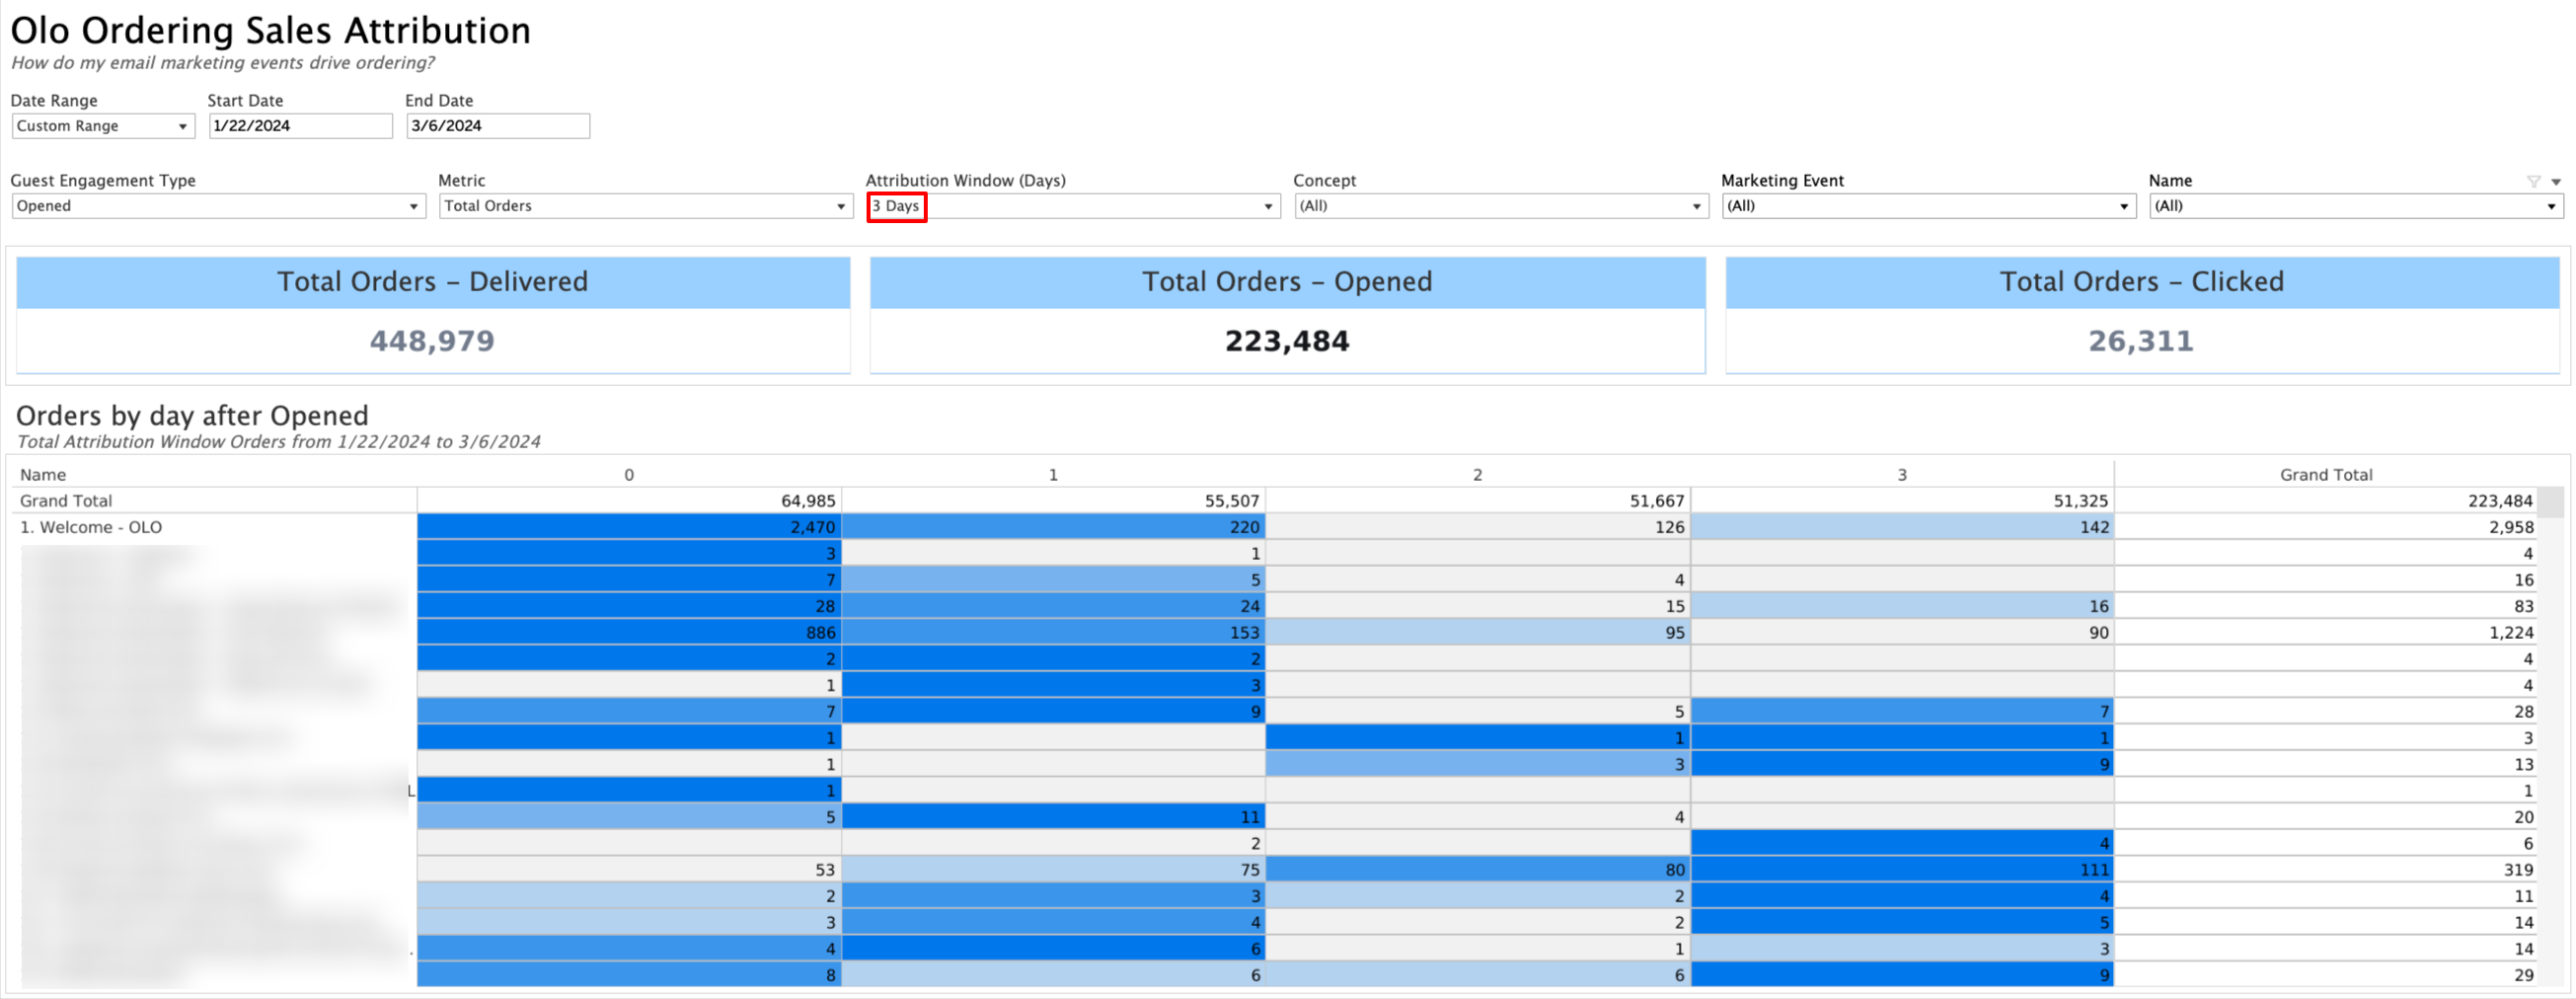
In this example, we have changed the Attribution Window from seven to three days but left the other filters the same. This changed the attributed Orders, using the Opened Guest Engagement Type, from 430,106 to 223,484. This means that in the first example, there were 206,622 Orders that occurred on days 4-7 of the attribution window.
There is no “correct” or “incorrect” attribution window to use. Generally speaking the further away an Order occurs from the Marketing Event the less likely it is to have been the primary motivator, but there is an element of subjectivity.
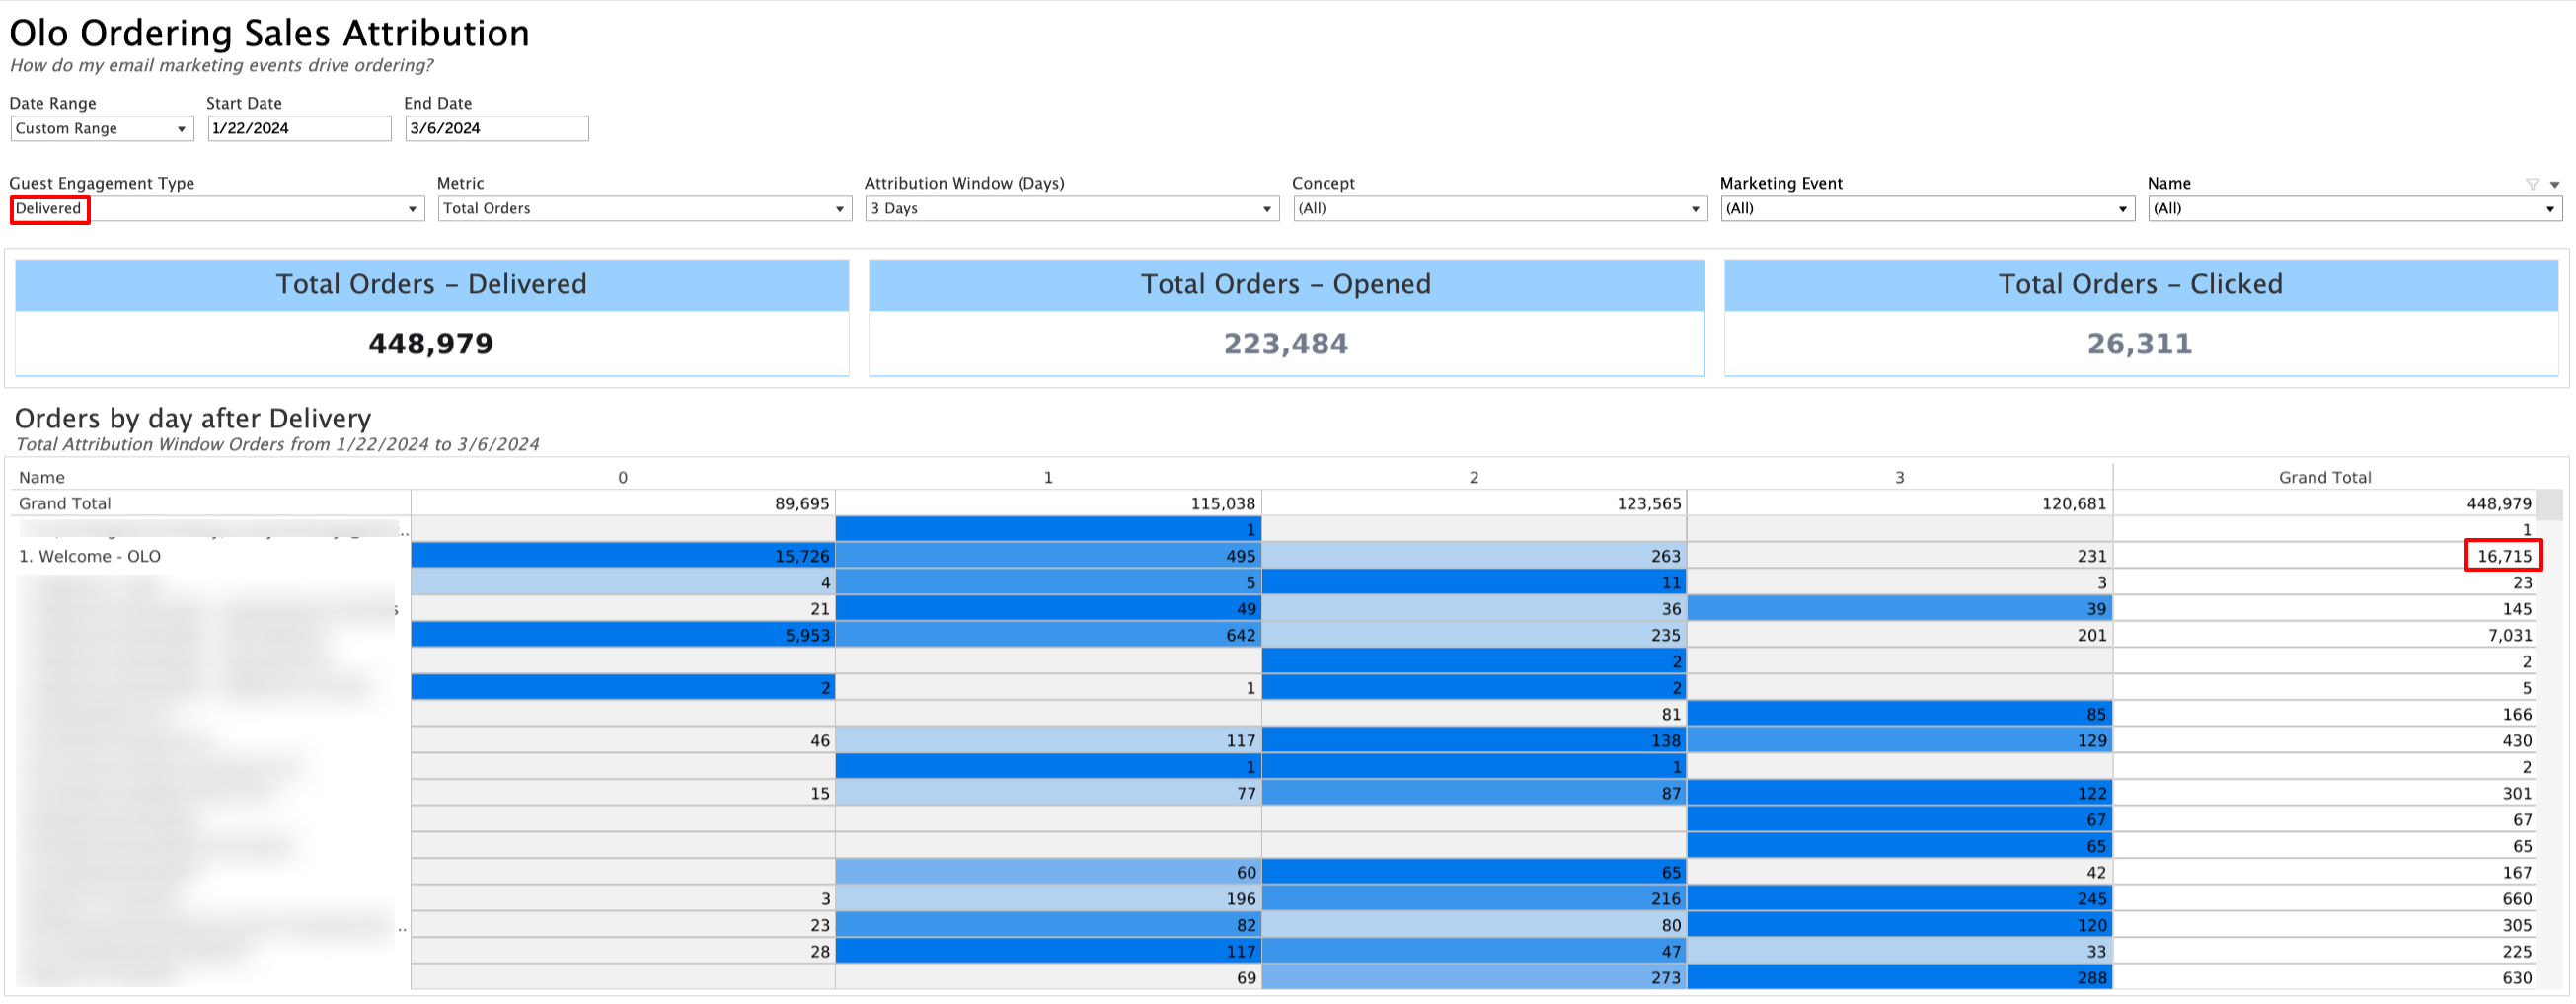
In this example we kept the three day Attribution Window but changed the Guest Engagement Type to Delivered, which resulted in the “Welcome - OLO” Marketing Event to go from 2,958 Orders to 16,715. Brands may want to consider using shorter Attribution Windows for the Delivered methodology and longer ones for Opened and Clicked. A brand may also want to consider how attribution is handled in other business and marketing platforms they are using to keep the comparisons as “apples-to-apples” as possible.
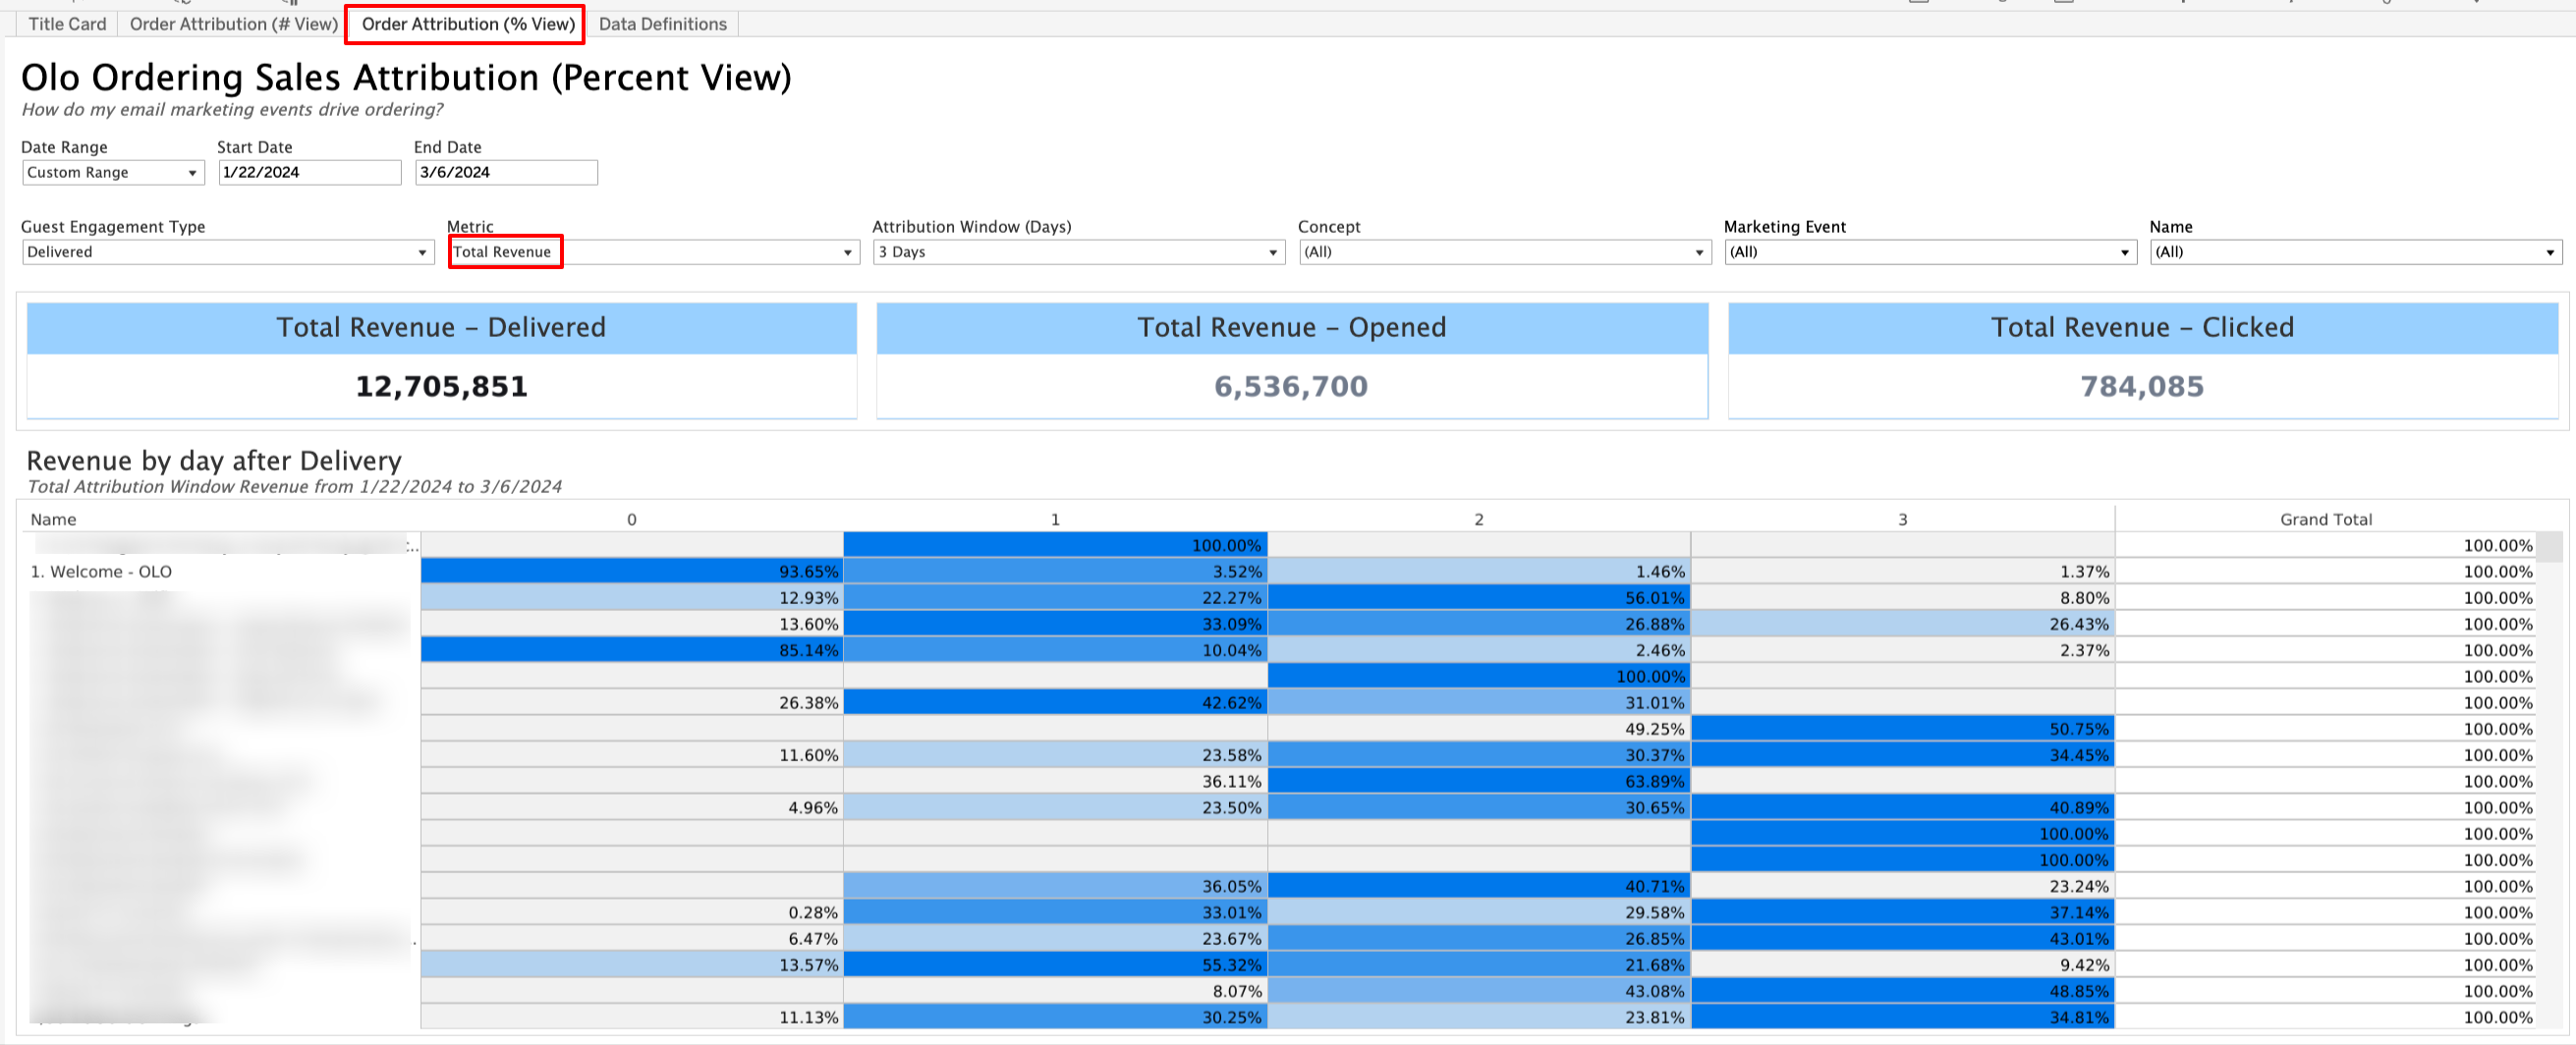
In this example we changed two things:
-
We switched from the Order Attribution (# View) tab to the Order Attribution (% View) tab (see Metric Format in the glossary above)
-
We changed the Metric from Orders to Revenue
The Metric Format change is particularly helpful for understanding how much time passes from content delivery/engagement to transaction. In this case we can see that 94% of Revenue was captured on the same day of the “Welcome - OLO” automation, which makes intuitive sense because it is an on-premise, WiFi triggered automation.
In other cases, you see a wider distribution of Revenue across the attribution window. For example, if you send an email Campaign on Thursday communicating a sale on Saturday, it would make sense for there to be a lag between the Campaign send and guests completing an Order.
Additional Resources
For insights into other reports you may have access to, please review the Engage Analytics Suite Overview Help Center article.